
 Revenue Cycle Management
How Measuring Revenue Cycle Metrics Drive RCM Excellence

January 29, 2026
|


Content
Effective Revenue Cycle Management (RCM) is crucial for healthcare organizations to thrive financially in the ever-evolving healthcare landscape. A key tool that empowers organizations to measure and optimize their RCM efforts is using Key Performance Indicators (KPIs).
KPIs refer to specific metrics or measures used to assess the performance and effectiveness of financial processes related to healthcare revenue.
To illustrate the importance of revenue cycle metrics, let's consider a real-world scenario.
Imagine a healthcare organization experiencing a high rate of claim denials. By implementing a KPI focused on the denial rate, the organization can closely monitor and track the percentage of denied claims over a specific period. This KPI helps identify root causes, such as incorrect coding or incomplete documentation, enabling the organization to take corrective actions and reduce denials, ultimately enhancing revenue collection.
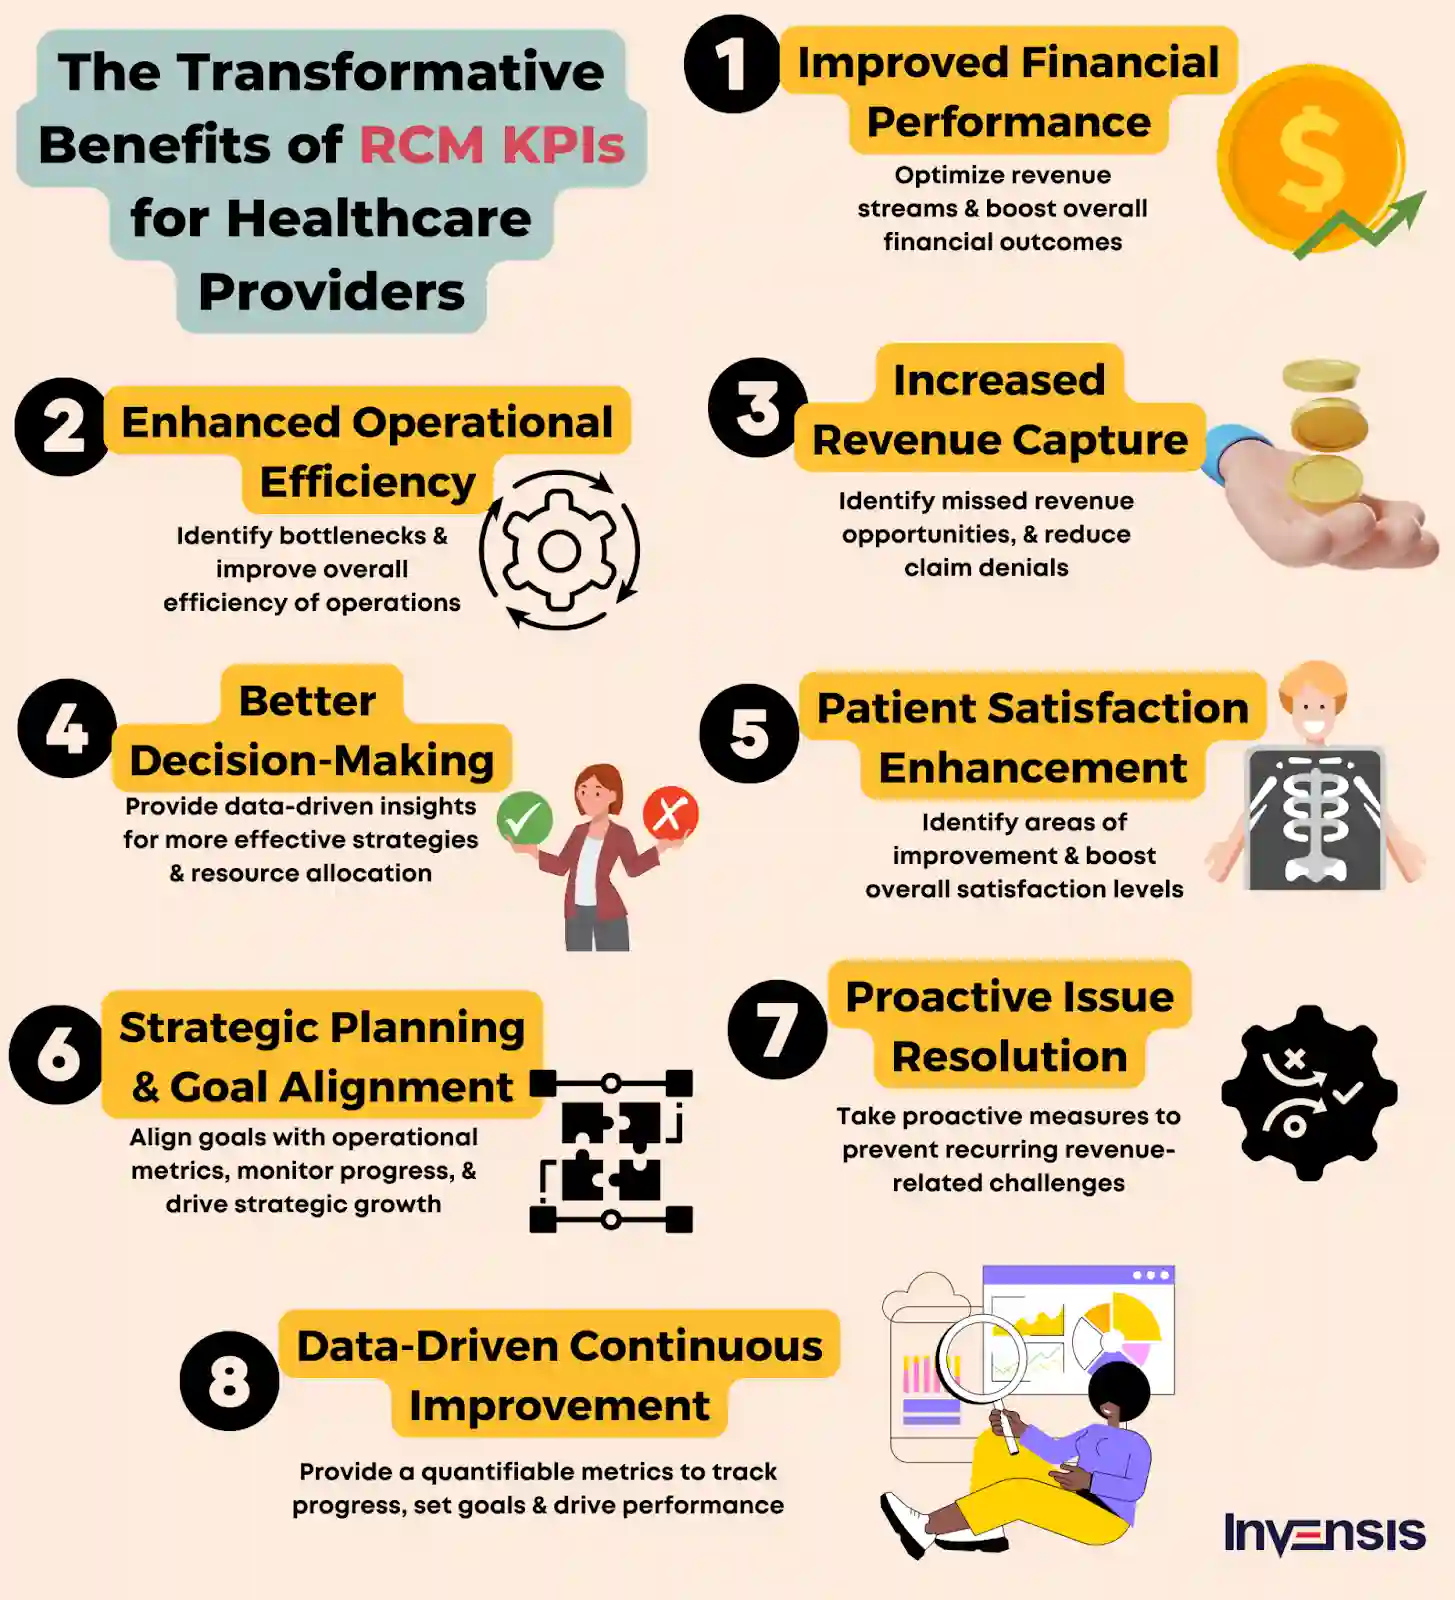
The above-explained metric is one of the Operational KPIs. Like this, there are six more types of KPIs (Financial, Patient Satisfaction, Productivity, Compliance, and Revenue Integrity).
Revenue cycle metrics help healthcare organizations track and measure crucial aspects of the revenue cycle. Dedicatedly working on improving RCM KPIs helps achieve better financial outcomes.
However, choosing the right revenue cycle metric can be daunting for organizations. The sheer number of available metrics and the need to align them with organizational goals can lead to confusion.
To overcome this confusion, clearly define your organization's RCM goals. Consult stakeholders and external consultants for deeper insights. And then, start by focusing on a single RCM component or process based on your priority. With proper monitoring, you can improve performance and revenue generation.
What are the 3 Ps of RCM?
People, Processes, and Policies are the 3Ps of revenue cycle management.
So, let's discuss the key KPIs that will impact the financial success of healthcare organizations in 2026.

What's New
Last updated on .

Revenue Cycle Metrics For Healthcare Providers & Practices
1. Net Collection Rate (NCR)
Net Collection Rate (NCR) is a popular KPI used in RCM to measure how well a healthcare organization collects the money it's owed for the services it provides.
It helps answer the question: "Out of all the money we billed, how much did we actually collect?"
Imagine a hospital that provides medical services to patients. When patients receive treatment or undergo medical procedures, the hospital bills them for the services rendered. This billing includes the cost of doctors' visits, diagnostic tests, medications, and any other healthcare services provided.
Now, let's say the hospital sends out bills to patients for a total of $100,000. After considering adjustments, such as discounts or contractual obligations with insurance companies, the hospital receives $85,000 in payments from patients and insurance companies. To calculate the NCR, divide the payments received ($85,000) by the total amount billed ($100,000) and multiply it by 100. In this case, the NCR would be 85%.
.webp)
A higher NCR means you're doing a good job at collecting most of the money you billed. But if your NCR is lower, it might mean that some customers are not paying or there are issues with your billing process.
By monitoring the NCR, you can see if there are any problems and take steps to improve.
For example, follow up with customers who haven't paid, clarify your billing process, or offer prompt payment incentives.
2. Days in Accounts Receivable (AR)
Imagine you are running a small practice, and you provide services to your patients. When your patients receive the services, they owe you money. You want to get that money as quickly as possible to pay your bills and keep your business running smoothly.
But sometimes, your patients can take a while to pay you. It's like waiting for a friend to return the money they borrowed from you. The longer you wait, the more it affects your cash flow and ability to operate your practice efficiently.
Days in AR is a way to measure how long it takes for your customers to pay you. It's like keeping track of the number of days your friend takes to return the money they owe you.
If all your customers paid you immediately, your Days in AR would be zero. That would be great because you get your money right away!
.webp)
But what if some patients take a long time to pay you? Maybe they forgot or are having financial difficulties. In that case, your days in AR will start to increase. It's like counting the number of days your friend keeps your money.
If you notice that your Days in AR are increasing, you should investigate why your patients are taking longer to pay. Are there any issues with your invoices? Are your patients experiencing financial difficulties? By determining the reasons behind the delay, you can improve your cash flow and make sure you get paid on time.
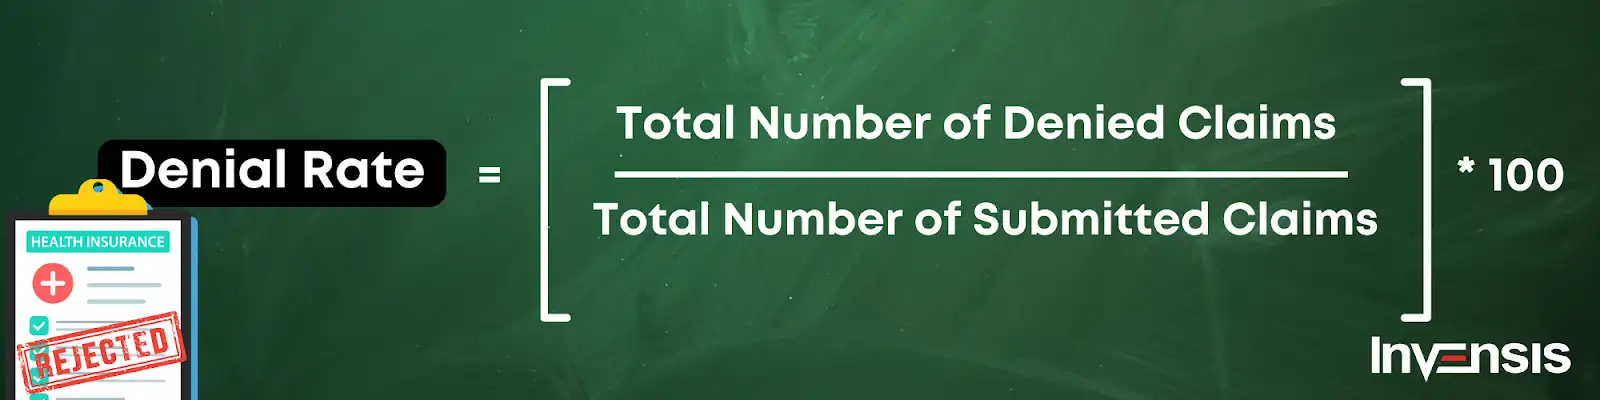
3. Denial Rate
The denial rate measures how successful a healthcare organization is in getting paid for its services. It’s one of the most crucial revenue cycle metrics to keep a close eye on for healthcare providers.
It helps answer the question: "Out of all the claims we submit for payment, how many get denied or rejected?
Let's understand this with a real-world example:
A medical practice or hospital provides healthcare services to patients. After treating them, they submit claims to insurance companies or government programs like Medicare or Medicaid to get paid for the services rendered.
Now, sometimes, these claims can be denied or rejected. It means the insurance company or program refuses to pay for the services or asks for more information to process the claim. Denials can happen for many reasons, such as missing information, coding errors, or lack of medical necessity.
To calculate the denial rate, divide the number of denied claims by the total number of claims submitted and multiply it by 100. For example, if you submitted 100 claims and 20 were denied, the denial rate would be 20%.
A lower denial rate is better because it means you're getting a higher percentage of claims approved and paid. A higher denial rate suggests that you're facing challenges in getting paid for your services, which can affect your revenue and financial stability.
You can identify patterns or common reasons for denials by monitoring the denial rate. This allows you to take steps to improve the accuracy and completeness of your claims, reducing the number of denials. For instance, double-check your claim information, provide additional documentation when needed, or improve your coding practices.
4. Claim Submission Rate
Have you ever wondered how doctors or hospitals get paid for their healthcare services? Let’s understand it in this section.
When healthcare providers treat patients, they send a bill to the insurance companies or government programs to ask for payment. It's like asking for reimbursement for the services they've given. But here's the interesting part: sometimes, these claims face obstacles and don't get through easily.
Now, the claim submission rate is a way to measure how well healthcare organizations manage to send in their claims. It tells us the percentage of claims submitted out of the total number of claims that could have been submitted.
Let's take an example to understand it better. If a doctor's office had 100 claims they could submit but only sent 80 of them, their claim submission rate would be 80%. It shows how many claims they took the initiative to submit.

A higher claim submission rate is good because it means that the healthcare provider is actively sending in their claims. It shows they are proactive in seeking reimbursement for their services. On the other hand, a lower claim submission rate suggests there may be challenges in submitting claims. It could mean they're missing out on potential payments.
5. Clean Claims Rate
Imagine a doctor's office or a hospital providing healthcare services to patients. After providing the necessary treatments, the healthcare provider submits claims to insurance companies or government programs, seeking payment for the services rendered.
Now, these claims can sometimes encounter obstacles. They may get rejected or denied due to errors or missing information. Think of it like a puzzle that needs to be perfectly assembled. A clean claim fits together flawlessly, containing all the necessary details and adhering to the specific requirements of the insurance company or program.
The clean claims rate measures the percentage of submitted and accepted claims without any hiccups. It reflects how well a healthcare organization can piece together these claims and approve them for payment.
To calculate the clean claims rate, divide the number of clean claims by the total number of submitted claims and multiply it by 100. For instance, if you submitted 100 claims and 80 of them were accepted without any issues, your clean claims rate would be 80%.

A higher clean claims rate is fantastic because it means you're submitting accurate and complete claims that sail through the process smoothly. It shows that you have a firm grasp of the requirements and guidelines, leading to better reimbursement and revenue.
Conversely, a lower clean claims rate suggests you encounter challenges in approving your claims. It could be due to missing information, coding errors, or other inconsistencies that prevent a seamless fit.
You can uncover patterns and reasons behind the rejected claims like solving a mystery. This enables you to take steps to improve your claim submission process, ensuring that the claims you submit are clean, accurate, and complete.
6. Patient Satisfaction Score
Picture this: You visit a doctor's office or a hospital seeking medical care. Going inside the doctor’s cabin, the doctor greeted you with a warm smile, listened attentively to your concerns, and explained your treatment options clearly. The staff was friendly and helpful, and the facilities were clean and comfortable. After your visit, you left feeling satisfied and confident in the care you received.
Now, think of another scenario: You went to a different doctor, but the staff seemed rushed and uninterested this time. The waiting room was crowded, and you had to wait long. When you finally saw the doctor, they seemed distracted and didn't give you enough time to ask questions. Overall, you left feeling frustrated and dissatisfied with the experience.
So, which experience was more satisfying for you?
Of course, the first scenario is the best!
Patient satisfaction score is a way to measure if patients had a positive experience or if there were any areas where improvements could be made. It’s like a report card considering factors such as the friendliness of the staff, the ease of making appointments, the cleanliness of the facilities, the quality of communication with healthcare providers, and much more.
By collecting patient feedback, healthcare organizations can identify areas where they excel and areas where they need to improve. They can listen to your voice and make changes to ensure that future patients have better experiences.

So, the next time you visit a doctor or a hospital, remember that your satisfaction matters! Your feedback can help them enhance their services and provide even better care to patients like you.
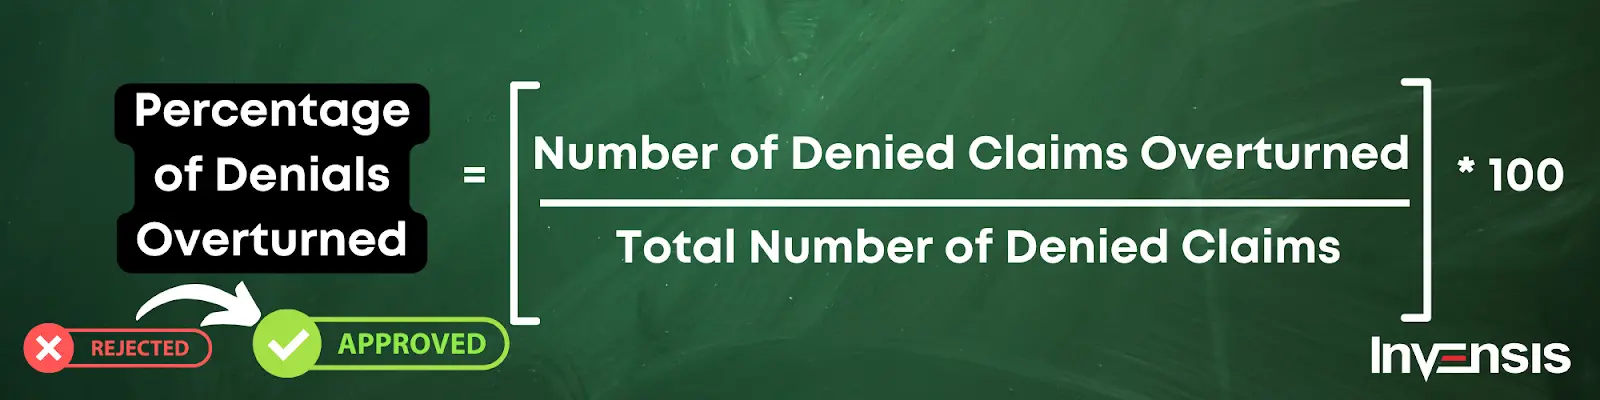
7. Percentage of Denials Overturned
Imagine you visited a healthcare organization or medical practice for necessary medical treatment. After receiving the treatment, the healthcare provider submits a claim to your insurance company or a government program to seek payment. However, sometimes, these claims face denials or rejections. It's as if the insurance company is saying, "Sorry, we can't pay for this because something is not right."
The percentage of denials overturned is a way to measure how many of these denied or rejected claims were later changed to be approved and paid. It's like giving a second chance to fix the missing pieces in the toy box and get the payment that the healthcare provider deserves.
A doctor's office submitted 100 claims to the insurance company, but 20 were initially denied. If they could overturn 10 of those denials and get them approved, their percentage of denials overturned would be 50%. That means they successfully fixed half of the missing pieces and got the payment they deserved.
Having a high percentage of denials overturned is great because it shows that the healthcare provider is determined and skilled at fixing any issues with the claims. It means they don't give up easily and fight for what they rightfully deserve.
Conclusion
Implementing revenue cycle metrics can have a significant impact on the success and efficiency of healthcare organizations. These KPIs provide a framework for measuring and assessing various aspects of the revenue cycle, from claim submission to patient experience.
However, it is important to recognize that implementing revenue cycle metrics is not without its challenges. Collecting accurate data, establishing benchmarks, and ensuring consistent measurement daily require dedicated resources and efficient systems. It may require overcoming technical hurdles, training staff, and adopting robust technology solutions.
To succeed in implementing revenue cycle metrics, healthcare organizations need an expert support to prioritize a culture of data-driven decision-making and continuous improvement. Invensis has been a leader in offering multiple services under the umbrella of RCM for various healthcare providers for over 20 years. Contact us today to learn more.
.webp "Medium")
Susan is an experienced revenue cycle management (RCM) professional with extensive writing expertise. She excels at managing complexities effortlessly with a strong background in healthcare billing and reimbursement. Susan's proficiency spans various specialties, consistently providing valuable insights and tailored solutions. She specializes in coding compliance, claims processing, and revenue optimization. As a prominent writer in the RCM space, Susan delivers concise and practical advice, empowering healthcare organizations to confidently navigate the financial aspects of patient care.
Discover Our Full Range of Services
Click HereExplore the Industries We Serve
Click HereBlog Category
Related Articles

How quickly they turn invoices into cash, we break down what really happens inside the invoice validation clock
June 25, 2026
|

A practical guide for factors to identify invoice fraud, strengthen invoice validation, and protect funding decisions.
June 25, 2026
|
.jpeg)
How modern factoring support services empower factoring companies to scale, manage risk, and protect margins amid tightening credit conditions.
June 25, 2026
|
Services We Provide
Industries We Serve
